Togetherness Index falls for third year running

Angie White
16 October 2023, 6:40 AM
 The latest Togetherness Index shows us drifting apart
Perhaps not such a surprise in the aftermath of The Voice Referendum, but data just released shows that more than two fifths of Australians feel the country is more divided than a year ago.
The Togetherness Index measures the impact of communication on social cohesion, and our national score has fallen from 59 in 2020 to 56 in September in 2023.
COVID-19, the cost-of-living crisis and discussion around the Voice debate has led to a sense of disconnect with only 25 per cent of the respondents feeling Australia is united, while 44 percent believe we are more divided than 12 months ago.
The Matildas’ World Cup success and community spirit are, according to a quarter of Australians part of what is bringing us together.
The research from SenateSHJ reveals an overwhelming majority (75 percent) either think, or is unsure if, Australia is divided.
Darren Behar, Managing Partner at SenateSHJ, said “The cost-of-living crisis has driven feelings of division. There is a sense of the haves and have nots, and that people are less likely to look out for each other. This has compounded feelings of division brought on by COVID-19.
“Unfortunately, the way in which the debate around the referendum has unfolded is leaving many feeling like there is little room for open discussion.”
The biggest driver to the more divided scores is that people do not feel listened to, which has ultimately lowered the scores on the Togetherness index.
The Togetherness Index has explored which components of communication bring us together and looks at diverse sources including government, media, social media, family, friends and community organisations.
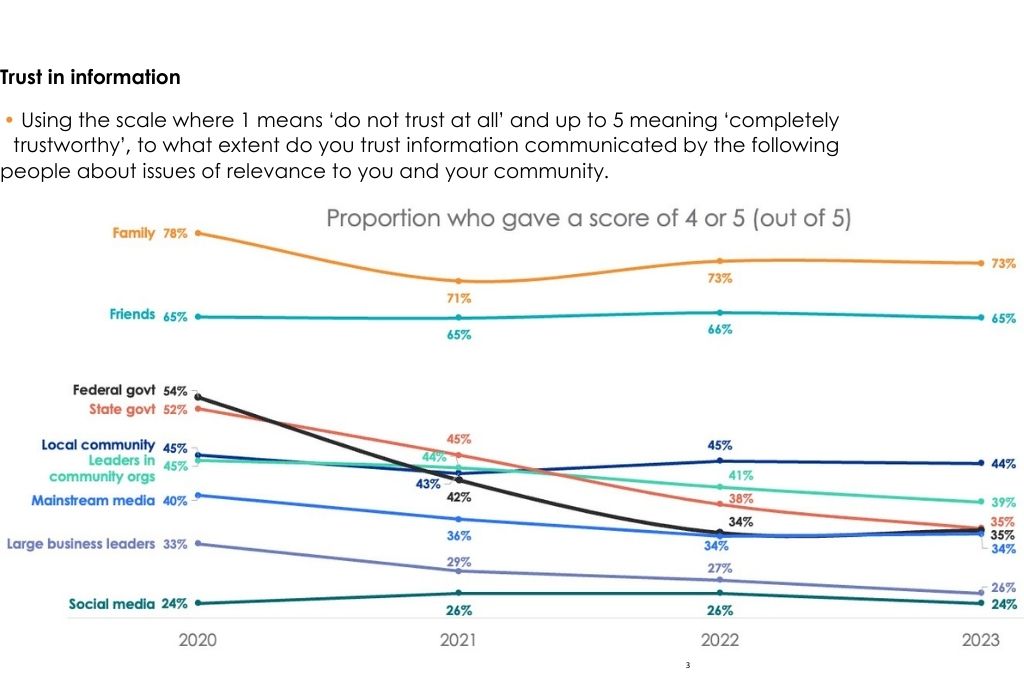
Not surprisingly, the research revealed that trust in communication from government, media and large corporations continues to decline.
Trusted sources of information come from more local sources as we continue to use those closest to us for connection, optimism and information.
While just a third of people trust government and media sources, three quarters trust their family and two thirds their friends and neighbours.
“The Togetherness Index helps guide how we reach people, how we communicate to enhance trust and togetherness," said Jodie Wrigley, head of Social Change at SenateSHJ. "There is an opportunity at every level of society from individuals to government, to bring communities together.
“With only 29 per cent of us feeling listened to, there is an opportunity for us as individuals, communities, organisations and governments to make a difference. Taking the time to listen to other people’s experiences, stories and points of view can help create stronger connections and make others feel heard and valued.”
About the Togetherness Index:
While there are many factors including wellbeing, health, economic opportunity and performance that contribute to overall social cohesion, the TI takes a unique perspective.
The TI identifies five communication drivers that rate highly in those who have the strongest sense of togetherness.
They are:
- Closeness: how close we are to different groups
- Listening: whether we feel listened to by people and institutions
- Optimism: how people feel after seeing, hearing or reading a message
- Stories: how exposed we are to stories from people with different backgrounds
- Effectiveness: how effective the communication we see, hear and read, is.
Each of these five elements is measured over time and an index score for each is determined. The overall combined average makes up the Togetherness Index.
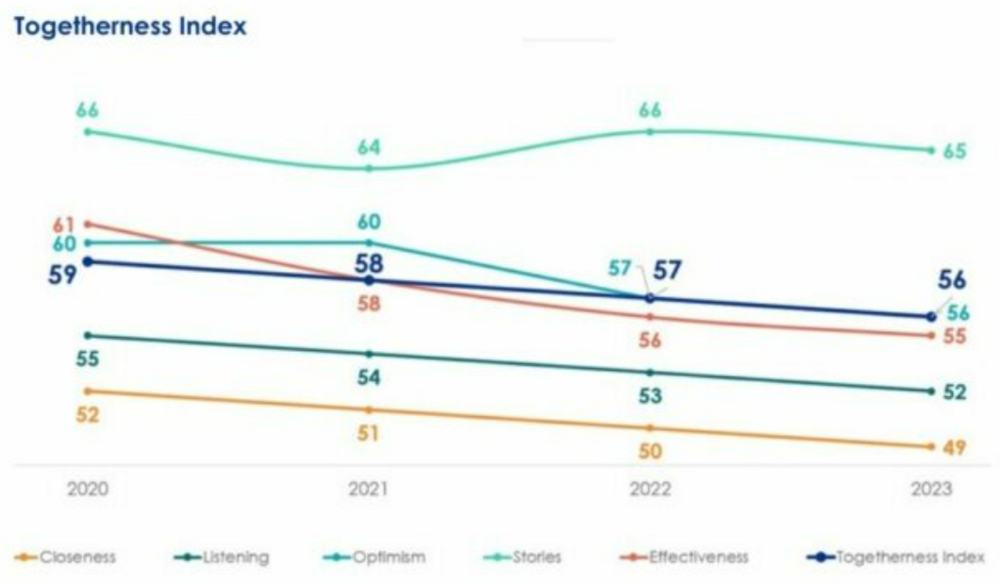
The dark blue line is the Togetherness Index, combining the factors of closeness, listening, optimism, stories and effectiveness.
A score of 100 means an ideal situation in which we are effectively using communication to drive social cohesion. The index shows the results for each of the five drivers and a total index based on the average of the five.
The TI is conducted online, with a sample size of 1,500 people aged 18+, sourced from ISO accredited research panel Dynata. Data is weighted to match the latest Census population statistics for gender, age, state and location, and resembles the Australian population based on these criteria. Fourteen demographic variables are also collected, including religion, country of birth, household income, education, employment status and NESB background.


