Western Plains back in spotlight as habitat clearing figures released

Kristin Murdock
22 February 2026, 8:20 PM
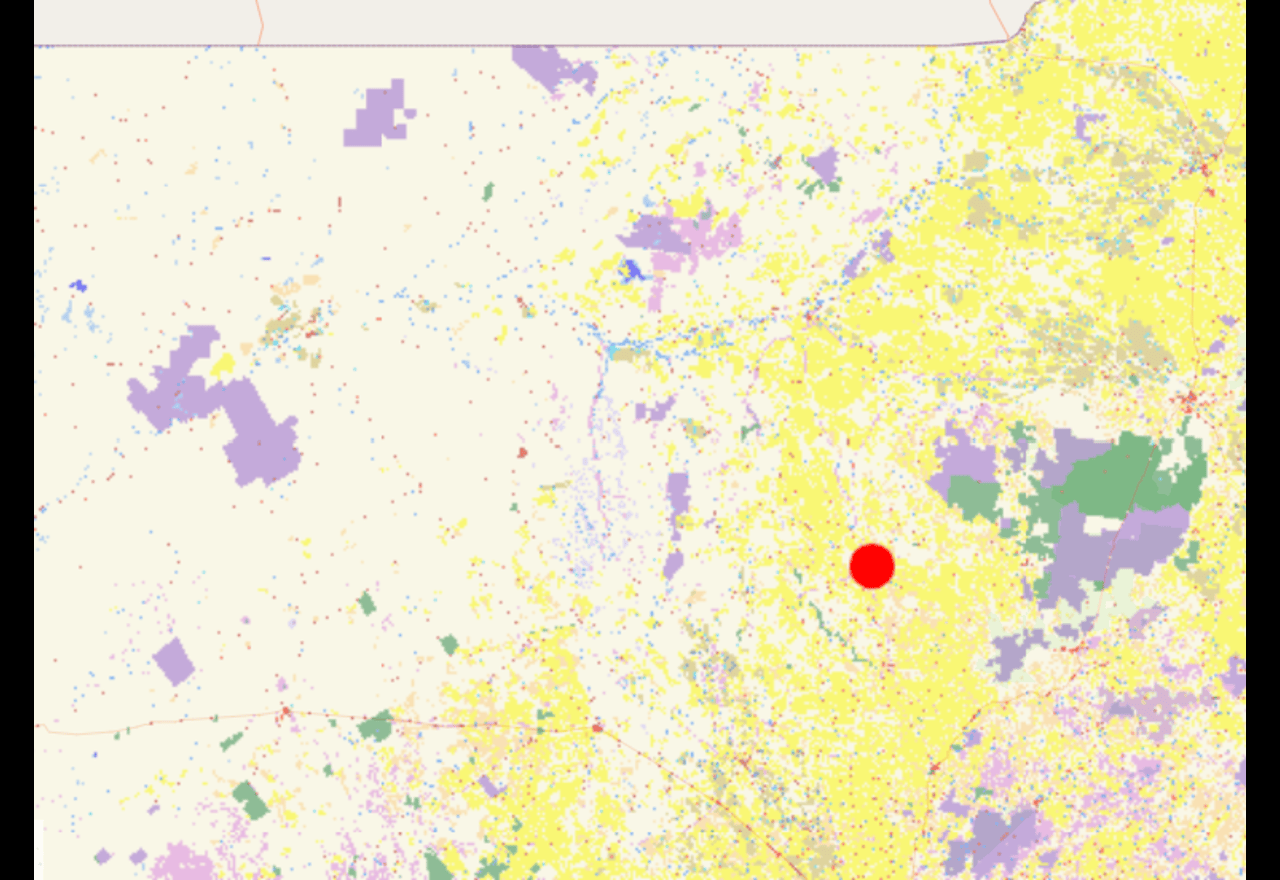 Mapping data around Coonamble (red dot) shows cropping in yellow, while further west the land use is grazing (white)
Western NSW, historically one of the state’s highest land-clearing regions, is back in the spotlight after new analysis revealed more than 677,000 hectares of native vegetation was cleared across NSW in the past 13 years.
Although the latest report does not provide a regional breakdown, past NSW Government clearing data has repeatedly shown inland agricultural districts record higher rates of broadscale clearing than coastal zones.
A new report warning of continued destruction of high-value habitat under NSW’s land clearing laws has renewed attention on western and north-western NSW, regions historically associated with some of the state’s highest levels of broadscale clearing.
The Nature Conservation Council of NSW (NCC) says new analysis by the Wentworth Group of Concerned Scientists shows that between 2010 and 2023, 677,500 hectares of native vegetation was cleared across NSW.
That includes:
- 13,880 hectares identified as high biodiversity value habitat
- 33,682 hectares in sensitive riparian areas - land within 100 metres of a major river, 50 metres of a minor river, or 200 metres from a lake edge
Clearing also occurred in habitat used by 709 threatened or migratory species found in NSW.
NCC CEO Jacqui Mumford said the findings showed land clearing remained one of the greatest drivers of biodiversity decline.
“High-value habitat that should be untouchable is still being bulldozed,” Ms Mumford said.
The report found the critically endangered Narrabarba wattle had 16.5 per cent of its mapped NSW distribution cleared, while the threatened Warkworth Sands Woodland ecological community in the Hunter Valley lost 14.2 per cent of its mapped extent.
Agriculture remains the largest driver of land clearing in NSW, according to the report.
Much of the clearing is authorised under the ‘invasive native species’ (INS) code, introduced under the former Liberal-National Government.
Farmers respond
NSW Farmers has previously rejected claims that farmers are driving environmental decline, arguing land clearing figures are often presented without important context.
In past media statements responding to biodiversity and clearing reports, the organisation has said farming businesses manage large areas of land for conservation outcomes, and that headline clearing figures do not always account for regrowth management, invasive native species control, or land set aside for environmental purposes.
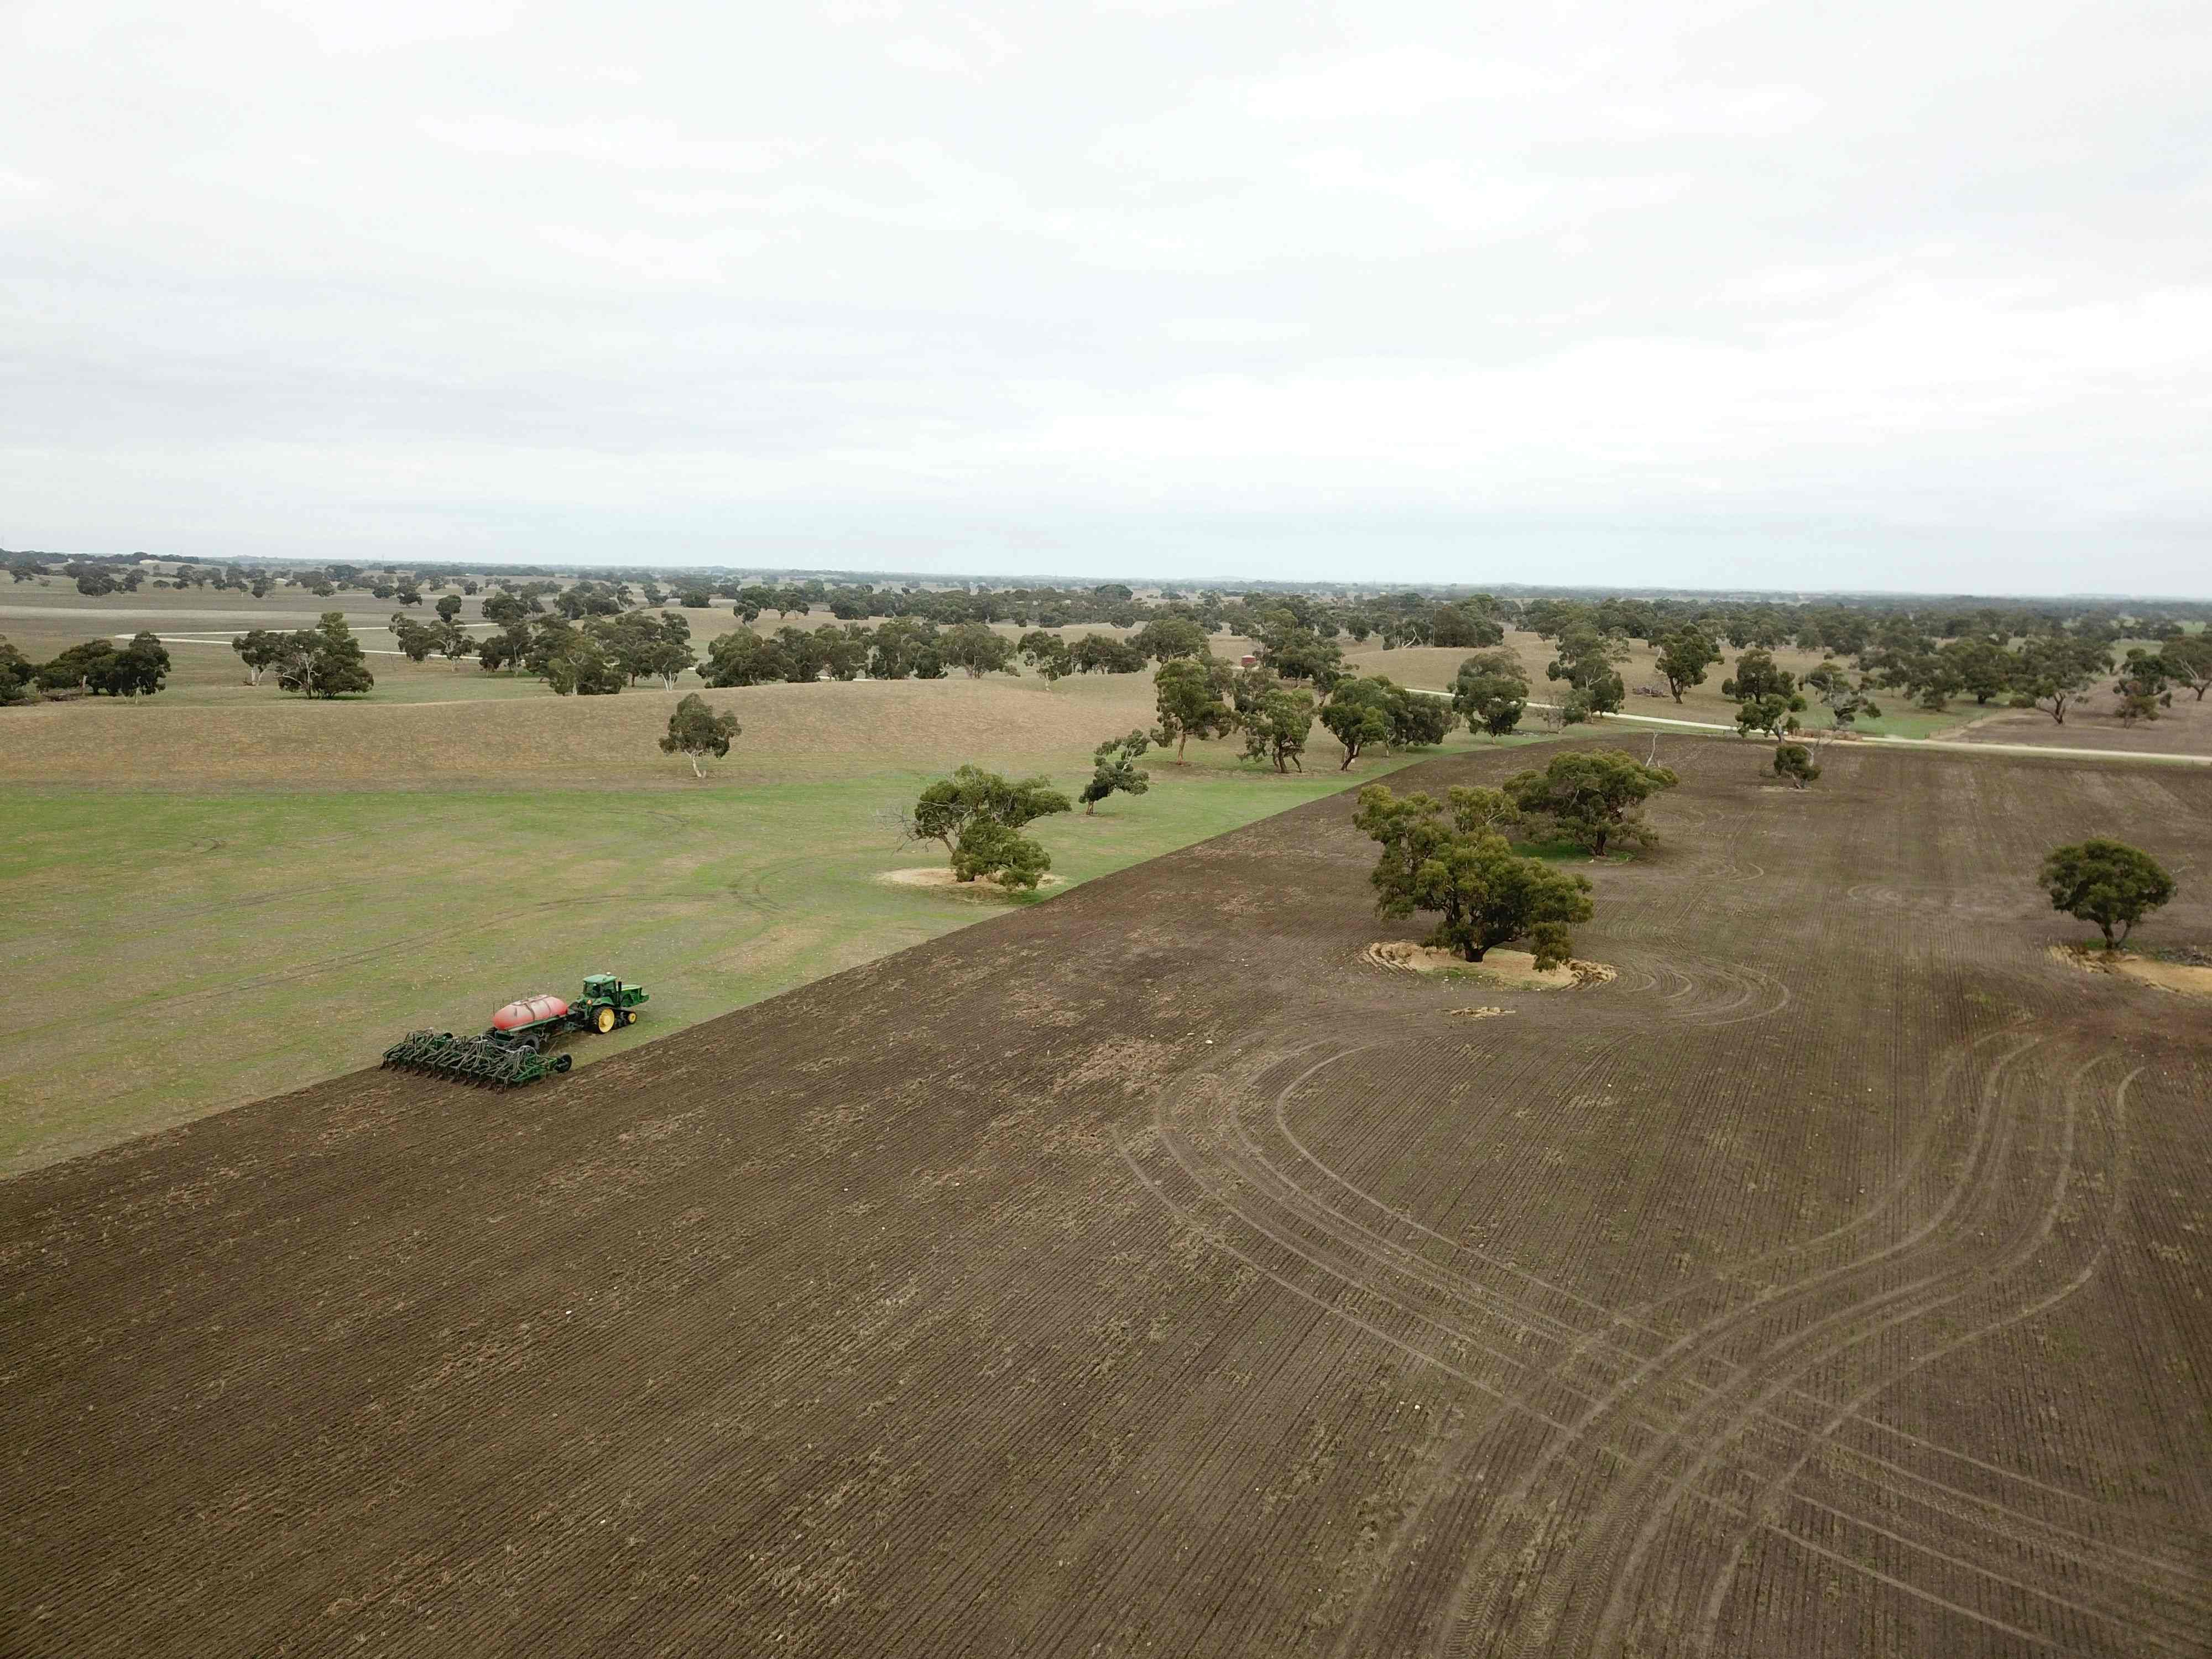
Agriculture remains the largest driver of land clearing in NSW, according to the latest comment from Nature Conservation Council of NSW.
The peak body has also maintained that farmers operate within a regulated framework and that landholders should not be portrayed as environmental vandals.
On the issue of the invasive native species (INS) code, identified in the Wentworth Group report as enabling significant clearing, NSW Farmers has previously supported maintaining practical management tools that allow landholders to control regrowth and maintain productivity.
The organisation has consistently argued that biodiversity reform must strike a balance between environmental protection and food and fibre production, warning against policy settings it says could restrict agricultural viability without delivering measurable environmental gains.
What does this mean for western NSW?
While the media release does not provide a breakdown by Local Land Services region or specific local government areas, historical NSW Government land clearing data has consistently shown higher clearing activity in western and north-western NSW compared to coastal regions.
Broadscale clearing has frequently been concentrated in the north-west slopes and plains, the Darling Riverine Plains, the Brigalow Belt South bioregion, parts of the Western Local Land Services region.
Previous Statewide Landcover and Tree Study (SLATS) reporting and NSW Department of Planning and Environment annual land management reports have shown that inland agricultural regions account for a significant share of clearing activity.
However, the Wentworth Group media release does not specify how much of the 677,500 hectares cleared between 2010 and 2023 occurred in western NSW specifically.
Readers seeking region-by-region data can view official government clearing maps here.
These platforms provide interactive mapping and annual clearing data by region and bioregion.